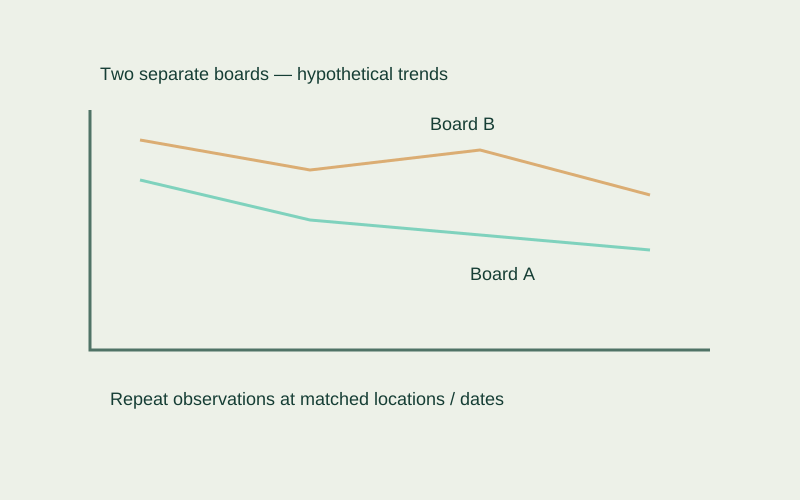
- Keep individual board histories visible; an average can hide a different trajectory.
- Compare readings only with their method, location, conditions and time recorded.
- No measured values or readiness thresholds are implied by these hypothetical trends.
Start with the observations behind the line
A trend chart is useful only when its points have clear identities. Keep board, position, date, meter, mode, and setting available beside each value. Electronic observations can be affected by the material and technique. A smooth line should not obscure a change of instrument, location, or sampling plan. Mark those changes so readers know when comparisons need extra care.
Distinguish change over time from a changing sample
When the same documented board positions are observed again with a comparable method, their paired values can be shown as matched observations. Newly accessible boards add information about the stock, but they do not become the later measurements of other boards. If the mix of sampled boards changes, label the session summaries accordingly. A falling average alone does not establish that every original board changed.
Use simple summaries with clear labels
The arithmetic mean is the sum of valid observations divided by their count. The spread is the maximum minus the minimum. Both describe the observations entered, not every unmeasured board. Show the individual values and distinct-board count. Report a difference between moisture percentages in percentage points: subtraction answers a different question from a relative percentage change.
- Treat blank entries as missing, not zero.
- Keep out-of-range or invalid observations flagged.
- Do not hide unusual observations behind the mean.
- Separate corrected values from raw display values.
Keep the interpretation within the evidence
A similar value on successive occasions can be useful context, but this website does not convert stability into installation clearance. Compare the record with the applicable product and project requirements. Note whether the method, storage, or ambient conditions changed between sessions. Where the evidence is incomplete, a clearly stated limitation is more useful than a reassuring label generated from a chart.
Hypothetical sample change that moves the average
A first session records boards A and B. A second session records A and B again and adds newly exposed boards C and D. The tool displays A and B as matched pairs and lists C and D as new observations. It labels the second session's average as a four-board summary instead of comparing it uncritically with the original two-board average.
Common questions
Does a flat trend mean installation can begin?
Not by itself. Review the applicable requirements and the method and coverage of the observations; the chart is a record, not a readiness certification.
Why show individual values if an average is available?
An average can conceal differences among observations. Individual values retain the locations that may require a separate review.
Evidence & limits
Reviewed September 13, 2026. Sources support their stated technical principles; this site's workflows and hypothetical examples are not product tests, supplier approvals or independently reviewed project records.